The Piper diagram graphically provides us with all the chemical information on the content of our water in our irrigation or pore size. It is a quick way to visualise the percentages of cations and anions that make up the different waters.

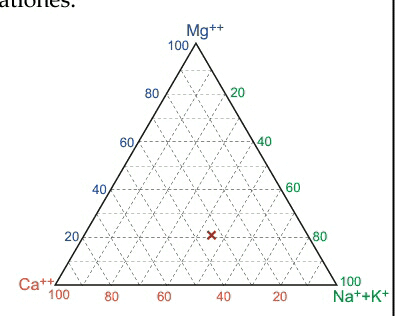
The triangle diagrams show the proportion of three components and their sum should represent 100% of the total. In these diagrams two triangles are used, one for the sum of the cations (Ca/Mg/Na+K) and one for the sum of the anions (Cl/SO4/HCO3+CO3). Thus we can see the example of a cation triangle:
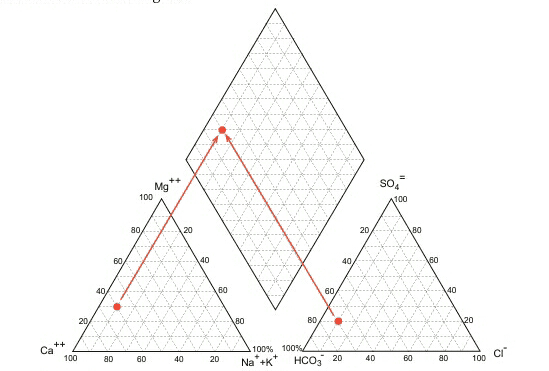
The same is done for the anions, and then the points of both triangles are joined up to their intersection in the upper rhombus, where the trucks and anions are now represented at the same time.
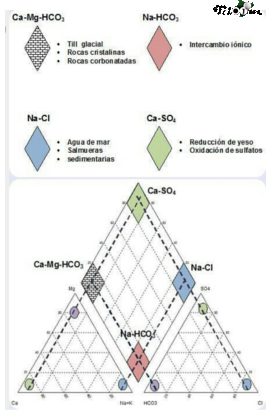
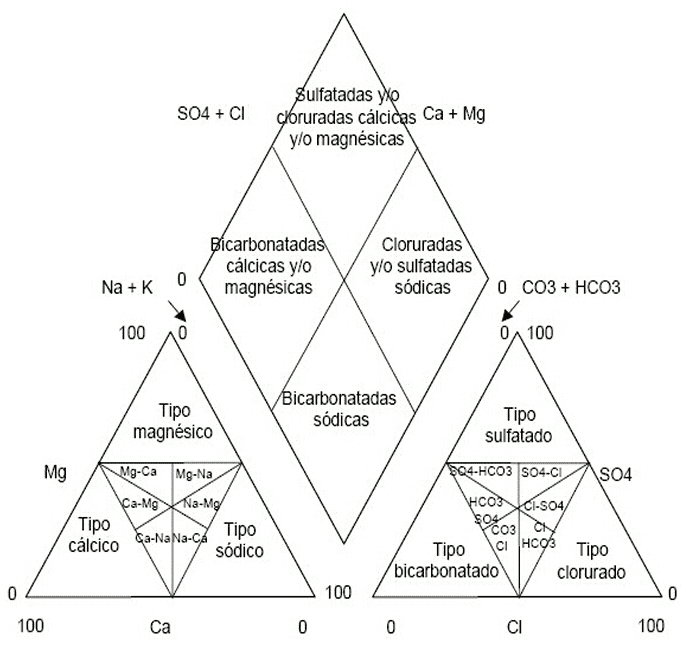
Each region of the rhombus will give us information about the nature of the water and thus we will be able to know its behaviour in relation to the soil.
There are different ways to solve these diagrams, many statistical programmes, water engineering software and there are even Excel "books" programmed for this purpose.
Tiloom provides the Piper diagrams in their reports for a better understanding of all the information contained therein.