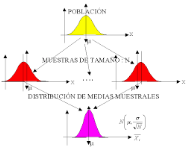
The sample collection is intended to obtain relevant information about a particular soil; although the samples are intended to represent all soil areas, what we call "the population", they may or may not be representative of the population.
All soils have properties that vary horizontally and vertically, so samples should be divided according to whether they come from greens, tees or fairways with similar characteristics.
The most widely used and important statistical parameter of sampling is the arithmetic mean of a variable among a collection of samples, x‾ The dispersion of individual samples around the mean is given by the variance, s², a large variance indicates large dispersion and a small variance, small (ideal) deviation. The standard deviation, s, is the square root of the variance. The standard error of a sample, s×, gives the confidence in the value of the mean, x‾
Therefore, for large numbers of samples, we can be 95% confident that the population mean will be within two standard errors of the mean; thus, if in a soil we have a mean Potassium, K, measurement of 11 ppm and an error standard of 1.5 ppm, the actual population mean will be between 8 and 14 ppm. This estimate will be wrong only 5% of the time, solely due to natural variation in sampling.
Statistics
The values obtained by adding or subtracting two standard errors from the mean give the 95% of the confidence limit. Confidence limits for any level, 67, 80, 90, 95 or 99% can be calculated through the mean and standard error.
Variance, the measure of variability between units, is often a function of the size of the units, with larger values tending to have larger variances than smaller units. Thus, root lengths have larger variances than mean root diameter. The coefficient of variation, CVexpresses the relative variability by dividing the standard deviation by the mean, CV%=100 s/x‾.
Sampling and its analytical work is expensive, but these costs can be minimised by taking only the number of samples necessary to give the required level of precision. Thus, we can use the following formula:
n=t²s²/D²
where n, the number of samples; t, a number chosen for a level of precision, such as 95%; s², the variance s² known in advance from other studies; D, the variability in the sample estimate that we accept.
This makes it possible to determine the optimal number of samples to achieve the most efficient results.
If you have already read Statisticians in Sampling you might be interested in...
And you will have priority access to our exclusive promotions and offersideal for saving money on your purchases and keeping your sports and agricultural fields at the forefront!
In addition, we will keep you informed about the LATEST NEWS in Greens and Agriculture with the latest entries of our Greenkeepediaincluding innovations, events and interviews with experts.
This website uses cookies so that we can provide you with the best user experience possible. Cookie information is stored in your browser and performs functions such as recognising you when you return to our website and helping our team to understand which sections of the website you find most interesting and useful.
Strictly Necessary Cookies
Strictly Necessary Cookie should be enabled at all times so that we can save your preferences for cookie settings.
If you disable this cookie, we will not be able to save your preferences. This means that every time you visit this website you will need to enable or disable cookies again.


One Response
Hi, it is not clear to me which values you use in the equation. Could you please clarify?