

Have you ever wondered how to interpret a Piper diagram effectively? Sometimes it is difficult to read diagrams when you are not very used to this kind of tools. In this post we are going to review how to interpret a Piper diagram and what it means for a point to be located in a particular area.
In addition to reading and interpreting these graphs, we will highlight its relevance in the study of groundwater, surface water, agricultural and environmental applications.
The Piper diagram, developed by Arthur M. Piper in 1944is a trilinear chart which facilitates the visualisation of water chemistry through the representation of the concentrations of major cations and anions. This graph not only helps to identify the type of waterbut also to understanding geochemical processes that affect its composition.

The diagram is divided into two triangles (one for cations and one for anions) and a central rhombus that integrates both compositions. The location of a point within these areas provides detailed information about the WATER QUALITY.
As you can see in the image above you can see how to read a graph, it is important to be clear about this as the proportions can be completely different if you don't read it carefully.
Each side of the triangle represents one ion of the liquid to be studied from 0% to 100%. For example, in the figure above the divisions are represented every 20% and the chlorine anion represents 43% of the total anions. And calcium cation represents 14% of the total cations.
In 1944, Arthur M. Piper devised an effective graphical procedure for presenting water chemistry data. This procedure is based on the premise that the cations and anions in water are generally in chemical equilibrium.
Once the point defined the graph can be divided into different highly representative areas. The triangle of bottom left is that of the cations. The positive ions found in the liquid under study are represented here. Bottom right is the triangle of the anionswhere the negative ions of the solution are located.
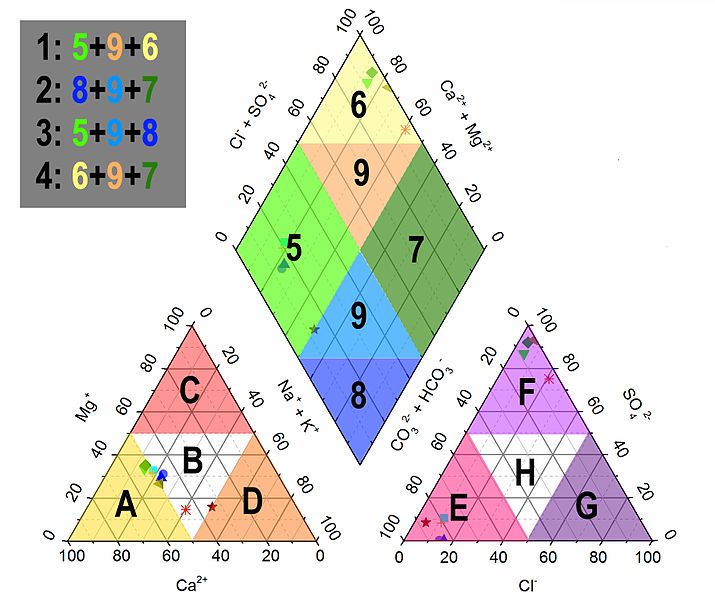
Just above both is the rhombus that relates them, and combines them. Each figure can be subdivided into smaller ones, in the following table is the legend.
| A | Calcium |
| B | Non-dominant |
| C | Magnesica |
| D | Sodium and potassium |
| E | Bicarbonate |
| F | Sulphate |
| G | Chlorinated |
| 1 | Soils more alkaline than water |
| 2 | Waters more alkaline than soils |
| 3 | More weak acids than strong acids |
| 4 | More strong acids than weak acids |
| 5 | Magnesium bicarbonate type |
| 6 | Calcium chloride type |
| 7 | Type Sodium chloride |
| 8 | Calcium bicarbonate type |
| 9 | Mixed type |
The interpretation of the Piper diagram allows determining the suitability of water for various uses, from agricultural irrigation to water resource planning. For example, water with a high concentration of sodium and chloride can be detrimental to certain crops, while a predominance of calcium and bicarbonate is often more favourable.
In order to carry out accurate analyses that feed into the Piper diagram, reliable and accurate tools are indispensable. The briefcase Laqua Twin Eco is presented as a comprehensive solution for the measurement of critical water quality variables. It includes:
This case facilitates the collection of accurate data for the interpretation of Piper diagramsmaking the process more accessible to professionals in different sectors.
Using piper diagrams is an excellent way to get an insight into the character of a water. May be seawater, wellThe water in the pores of the wastewater treatment plant, or at the inlet of a WWTP, or at the outlet, and even the water in the pores of the land. Any water is susceptible to analysis and study.
Understanding and correctly interpreting a Piper diagram is therefore essential for effective water management, water resources planning and environmental sustainability. Equipped with the right knowledge and precise tools such as the Laqua Twin Eco casewater analysis can be carried out efficiently, ensuring its proper use and management.
Exploring the Piper diagram but feeling a bit lost? Don't worry, here we break down the most common questions to help you better understand this essential tool in water analysis.
Look at where your dot falls on the central diamond: near the corners it tells you whether your water is more calcium friendly, sodium friendly, sulphate friendly, etc. It's like labelling the personality of your water.
It depends on what you use it for. For irrigation, Too much sodium can be problematic because it affects how water moves through the soil and can damage your plants.
If your dot is in the middle of the rhombus, you are probably looking at a mixture. It's like a cocktail of waters with different characteristics.
It means change. It can be seasonal, human activities or natural changes in your water source. It is a sign to investigate further.
If you see changes in cations and anions, minerals may be dissolving or precipitating. For example, more calcium could indicate dissolution of limestone.
Yes. If sodium goes up while calcium and magnesium go down, with no change in anions, something is exchanging ions along the way.
It means that your water is undecided. It does not have a clear cation or anion dominance, signalling that there are several things going on or mixtures of sources.
Yes, in a way. Water near the calcium and magnesium corners is probably harder, because those are the ions that make it feel "rough" to the touch.


5 responses
Quite helpful. Thanks for the good work
angelaurentandossa@gmail.com
Hello, if you have any questions, please contact us at info@tiloom.com
Best regards.
very good contribution with the law of minimums, how can we put it into practice with sugar cane crops?
Thank you for your message! To apply the law of minimums in sugar cane, the first thing to do is to carry out soil and foliar analyses to identify the most deficient nutrient: this is the one that will limit yield, even if the others are at adequate levels.
Then adjust the fertilisation plan by correcting that limiting nutrient at each stage of the crop (sprouting, tillering, elongation, ripening). For example, if there is a potassium deficiency in the elongation phase, even if you have good nitrogen, growth will be slowed down.
Tiloom can help you with diagnostic tools, sensors or analysis interpretation. Write to us at agro@tiloom.com and we will see it in detail according to your area. Best regards!